And How They Differ From Supply And Demand Zones
By Your Trading Mentor,
Trading Angel
WHAT ARE KEY LEVELS IN TRADING?
Key levels are important price levels that traders use to identify potential areas of support and resistance in trading. These levels can help traders make more informed decisions about when to enter or exit a trade, and can also help them manage their risk.
Here are some of the key levels that traders commonly use in stock trading:
1. Support Levels
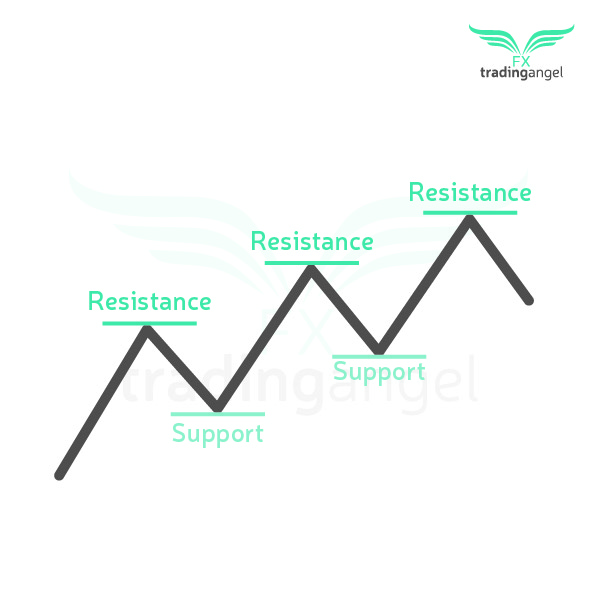
Support levels are price levels at which buyers are expected to enter the market and prevent the price from falling further. When the price approaches a support level, traders may look to buy the stock, as they believe that the price is likely to bounce back up from that level. If the price breaks through a support level, however, it may indicate that the stock is in a downtrend and that further declines are likely.
2. Resistance Levels
Resistance levels are price levels at which sellers are expected to enter the market and prevent the price from rising further. When the price approaches a resistance level, traders may look to sell the stock, as they believe that the price is likely to fall back down from that level. If the price breaks through a resistance level, however, it may indicate that the stock is in an uptrend and that further gains are likely.
3. Pivot Points
Pivot points are calculated based on the high, low, and close prices of the previous trading day, and provide potential support and resistance levels for the current day. Traders use pivot points to identify potential entry and exit points, as well as to set stop-loss orders and profit targets.
4. Fibonacci Levels
Fibonacci levels are based on the Fibonacci sequence of numbers, and are used to identify potential areas of support and resistance based on previous price movements. The key Fibonacci levels used in stock trading are 23.6%, 38.2%, 50%, 61.8%, and 100%. Traders may look for price reversals or breakouts at these levels.
5. Round Numbers
Round numbers, such as £50 or £100, are psychological price levels that can also act as areas of support and resistance. Traders may look for price reactions at these levels, as they are often seen as significant milestones for the stock.
By understanding these levels and how they can affect the price of a stock, traders can make more informed decisions about when to enter or exit a trade. However, it’s important to remember that no level is foolproof and that market conditions can change rapidly. Therefore, it’s important to always have a solid trading plan and to manage risk appropriately.
WHEN TO USE KEY LEVELS IN TRADING
As a trader, identifying key levels is an essential part of your trade setup. Key levels are price points on a chart where price has previously reacted in a significant way. These levels can act as support or resistance and can provide valuable information for making trading decisions. In this blog post, we will discuss when in your trade setup you should identify key levels.
The first step in identifying key levels is to analyse the market and identify the overall trend. This will help you determine whether you should be looking for long or short opportunities. Once you have identified the trend, you can begin to look for significant levels where price has previously reacted.
One common way to identify key levels is to draw support and resistance lines on your chart. Support levels are price points where buying pressure has previously entered the market and stopped the price from falling further. Resistance levels are price points where selling pressure has previously entered the market and stopped the price from rising further. These lines can be drawn by connecting the lows or highs of the price action.
Another way to identify key levels is to use technical indicators such as moving averages, Fibonacci retracements, and pivot points. These indicators can help you identify levels where price is likely to react based on mathematical calculations.
Once you have identified key levels on your chart, it is important to monitor them closely. Price may react differently at each level, and it is important to understand how the market is responding. If price breaks through a key level, it may indicate a shift in the market trend, and you may need to adjust your trading strategy accordingly.
identifying key levels is an important part of any trade setup, and it should be done during the analysis phase of your trading process. Key levels can provide valuable information about the market and can help you make more informed trading decisions. Whether you use support and resistance lines or technical indicators, it is important to monitor key levels closely and adjust your trading strategy accordingly.
HOW TO DRAW ON KEY LEVELS
Here are some effective ways to draw key levels on your trading chart.
1. Identify the key levels – The first step in drawing key levels on your chart is to identify them. Look for areas where price has previously reacted in a significant way, such as areas where price has bounced off a support level or failed to break through a resistance level. Once you have identified these areas, mark them on your chart.
2. Use a line chart – When drawing key levels, it is best to use a line chart rather than a candlestick chart. A line chart will eliminate the noise and help you see the overall trend more clearly, making it easier to identify key levels.
3. Connect the lows/highs – To draw a support or resistance level, connect the lows or highs of the price action. For a support level, connect the lows of the price action, and for a resistance level, connect the highs of the price action. This will help you identify the level more accurately.
4. Check for multiple touches – Once you have drawn the initial line, check for multiple touches on the line. If the line has been touched multiple times, it is likely a strong key level. Adjust the line slightly to fit the touches more accurately.
5. Use horizontal lines for clarity – To make the key levels more visible on your chart, use horizontal lines instead of diagonal lines. This will make the levels stand out more clearly and make them easier to identify.
6. Review and adjust regularly – Key levels can change over time as the market evolves. It is important to review and adjust your key levels regularly to ensure they are still accurate and relevant for your trading strategy.
Remember to review and adjust your key levels regularly to ensure they remain accurate and relevant for your trading strategy.
HOW KEY LEVELS AND SUPPLY AND DEMAND ZONES DIFFER
Key levels and supply and demand zones are two important concepts that traders use to identify potential areas of support and resistance in stock trading. While they may seem similar at first glance, there are some key differences between these two concepts that traders should understand.
Key Levels
Key levels are specific price points that traders use to identify potential areas of support and resistance. These levels may be based on technical analysis tools such as trend lines, moving averages, or Fibonacci retracements. Key levels can also be based on psychological levels, such as round numbers or all-time highs or lows.
The main advantage of trading with key levels is that they provide traders with clear levels to watch for potential price movements. Traders can use these levels to set entry and exit points, as well as to manage their risk by placing stop-loss orders.
However, key levels are not always reliable indicators of support and resistance. The market can be unpredictable and can easily break through a key level, leading to false breakouts or breakdowns.
Supply and Demand Zones
Supply and demand zones are areas on a price chart where the price is likely to encounter significant levels of buying or selling pressure. These zones are based on the idea that when there is more demand than supply, the price is likely to rise, and when there is more supply than demand, the price is likely to fall.
Supply and demand zones can be identified by looking for areas where the price has previously reversed direction. Traders may also use volume analysis to identify areas of high demand or supply.
The main advantage of trading with supply and demand zones is that they provide traders with a more nuanced understanding of market dynamics. By identifying areas of high demand or supply, traders can anticipate potential price movements and adjust their trading strategies accordingly.
However, supply and demand zones can be more difficult to identify than key levels. They may also be less reliable, as the market can break through a supply or demand zone if there is a significant change in market sentiment.
Key Levels vs. Supply and Demand Zones
In summary, key levels and supply and demand zones are both useful concepts for identifying potential areas of support and resistance in stock trading. Key levels provide clear price points for traders to watch, while supply and demand zones provide a more nuanced understanding of market dynamics.
The main difference between these two concepts is that key levels are based on technical analysis tools, while supply and demand zones are based on market sentiment and supply and demand dynamics. Traders should be comfortable with both concepts and use them in combination to maximise their trading strategies.
POPULAR DAY TRADING STRATEGY USING KEY LEVELS
Day trading is a popular trading style that involves buying and selling financial instruments within the same trading day. One popular day trading strategy is to use key levels to identify potential entry and exit points. In this essay, we will explore this strategy in more detail.
The strategy involves identifying key levels on a chart, which are price points where price has previously reacted in a significant way. These levels can act as support or resistance and can provide valuable information for making trading decisions. Traders can use a variety of tools to identify key levels, including support and resistance lines, moving averages, Fibonacci retracements, and pivot points.
Once the key levels have been identified, traders can use them to identify potential entry and exit points. For example, if a trader identifies a strong resistance level, they may look for short opportunities when price reaches that level. Conversely, if a trader identifies a strong support level, they may look for long opportunities when price reaches that level. Traders can use a variety of trading strategies to enter and exit positions, including breakouts, pullbacks, and trend following.
One of the advantages of this strategy is that it can be used in a variety of market conditions. Key levels can provide valuable information in both trending and ranging markets, and traders can adjust their trading strategy accordingly. For example, in a trending market, traders may look for breakouts of key levels to enter trades in the direction of the trend. In a ranging market, traders may look for reversals at key levels to enter trades in the opposite direction.
Another advantage of this strategy is that it can be used across a variety of financial instruments, including stocks, forex, and futures. Traders can use the same tools and techniques to identify key levels and make trading decisions across different markets.
However, there are also some potential drawbacks to this strategy. One potential issue is that key levels may not hold up in all market conditions. For example, a strong level of support may not hold up in a highly volatile market. Additionally, key levels may be more subjective and open to interpretation than other technical indicators, which could lead to different traders identifying different levels.
Using key levels to identify potential entry and exit points is a popular day trading strategy. Traders can use a variety of tools to identify key levels and can adjust their trading strategy to suit different market conditions. While there are some potential drawbacks to this strategy, it can be a valuable tool for traders looking to make informed trading decisions.
Until next time, Happy Trading!
Love From, Your Trading Mentor,
Trading Angel x